
UK M&A Market Activity H1-2022
What effect does a global pandemic, a war on European soil, and the subsequent related inflation have on the UK M&A market? Let’s find out!
With so many outside influences on the M&A market in the last couple of years it has been difficult for forecasters to predict trends and assess investor confidence. Fortunately, the good folk at Dealsuite prepared a report surveying 327 M&A advisory firms operating in the UK & Ireland M&A market and compared the data from H1 2022 with H2 2021.
We picked out some of the highlights:
TRANSACTIONS
Which sectors accounted for the total number of transactions?
There weren’t any significant changes or surprises here. Core sectors such as Healthcare & Pharmaceuticals and Agri & Food saw increases, so did Automative, Transportation & Logistics which is another encouraging post-pandemic sign. What might be most surprising is that Hospitality & Tourism and Retail Trade, sectors both dealt heavy blows by the pandemic, only saw minimal decreases (-1% and 0 respectively). With these sectors likely to be hardest hit by the rising inflation and energy costs, it’s worth keeping an eye subsequent reports.
Transactions per sector.
| H1-2022 | H2-2021 | Difference | |
|---|---|---|---|
| Business Services | 21% | 25% | -4 |
| Industrial & Manufacturing | 16% | 17% | -1 |
| Construction & Engineering | 14% | 14% | 0 |
| IT Services & Software Development | 11% | 10% | +1 |
| Automotive, Transportation & Logistics | 7% | 6% | +1 |
| Healthcare & Pharmaceuticals | 7% | 6% | +1 |
| E-commerce & Webshops | 6% | 5% | +1 |
| Agri & Food | 4% | 2% | +2 |
| Media & Communication | 4% | 5% | -1 |
| Retail Trade | 4% | 4% | 0 |
| Wholesale Trade | 3% | 2% | +1 |
| Hospitality & Tourism | 3% | 4% | -1 |
| 100% |
Deal size:
There were significant increases in deal size over the period too. Encouraging for our clients and reflective in the deals we have advised on during 2022 - the percentage of transaction over £5 million jumped from 38% to 55%.
Transactions per deal size.
| £ | H1-2022 | H2-2021 | |
|---|---|---|---|
| 10 million or above | 36% | +14 | 22% |
| 7.5 to 10 million | 14% | +7 | 7% |
| 5 to 7.5 million | 5% | -4 | 9% |
| 2.5 to 5 million | 13% | -2 | 15% |
| Below 2.5 million | 32% | -15 | 47% |
| 100% |
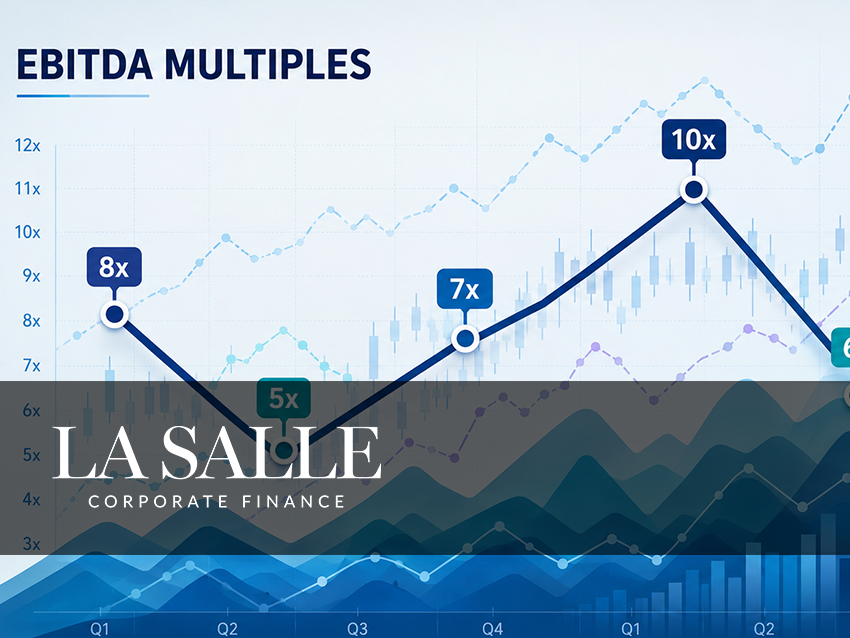
SECTOR MULTIPLES
During 2022 we at La Salle have seen an increase in the number of cross-border deals with a significant rise in interested parties from European and US investors and trade players. This table details the average multiples achieved in the UK when compared with neighbouring regions:
Comparison between average EBITDA multiple by sector (Enterprise Value) in the United Kingdom and Ireland and neighbouring countries.
| UKI | DACH | FR | NL | |
|---|---|---|---|---|
| IT Services & Software Development | 8.2 | 8.5 | 7.6 | 6.6 |
| Healthcare & Pharmaceuticals | 8.4 | 5.2 | 7.5 | 6.35 |
| Wholesale Trade | 3.7 | 4.8 | 4.5 | 5.55 |
| Agri & Food | 5.8 | 6.2 | 5.95 | 5.6 |
| Industrial & Manufacturing | 5.3 | 5.9 | 5.1 | 5.3 |
| E-commerce & Webshops | 7.3 | 7.2 | 6.0 | 5.6 |
| Business Services | 5.5 | 5.9 | 5.4 | 5.0 |
| Media & Communication | 4.5 | 5.2 | 4.75 | 4.4 |
| Construction & Engineering | 3.6 | 5.4 | 3.8 | 4.0 |
| Hospitality & Tourism | 4.4 | 3.9 | 4.5 | 3.3 |
| Automotive, Transportation & Logistics | 3.6 | 4.9 | 4.3 | 3.6 |
| Retail Trade | 4.1 | 3.4 | 5.1 | 3.0 |
| Average: | 5.4 | 5.8 | 5.45 | 4.85 |
BUYER INTEREST PER SECTOR
Also in the report was an insight into the average number of interested parties per firm, per sector. IT Services & Software Development continues to dominate the field in terms of interest from investors and trade buyers looking to consolidate.
Average number of interested parties per firm.
| IT Services & Software Development | 15.7 |
|---|---|
| Construction & Engineering | 13.5 |
| Business Services | 11.7 |
| Automotive, Transportation & Logistics | 11.6 |
| Industrial & Manufacturing | 11.5 |
| E-commerce & Webshops | 8.6 |
| Healthcare & Pharmaceuticals | 8.2 |
| Media & Communication | 8.2 |
| Wholesale Trade | 7.2 |
| Agri & Food | 6.6 |
| Hospitality & Tourism | 4.4 |
| Retail Trade | 4.1 |
| Average: | 9.2 |
To conclude, the report asked advisors to assess their satisfaction and optimism for the period. The majority (82%) look back at H1-2022 with a sense of satisfaction, with another majority (69%) expressing optimism for the months ahead.
This satisfaction and optimism is shared by the team at La Salle after a record-breaking year for the company (more details to follow in our end-of-year report).
We eagerly await the findings of the next Dealsuite report in the new year to compare and contrast. In the meantime, if you would like to discuss your exit options or have any questions about M&A activity in your sector reach out to the La Salle team to arrange a discreet, initial conversation.
More News & Deals...


Our 'Focus On' Resource Series...